Source Window
The Source window displays source files that have been loaded into the debugger.
Opening the Source Window
The debugger opens a source window when it loads a new source file. To restore or switch to an open Source window, in the WinDbg window, on the Window menu, select the window from the list of windows at the bottom of the menu.
The following figure shows an example of a Source window.
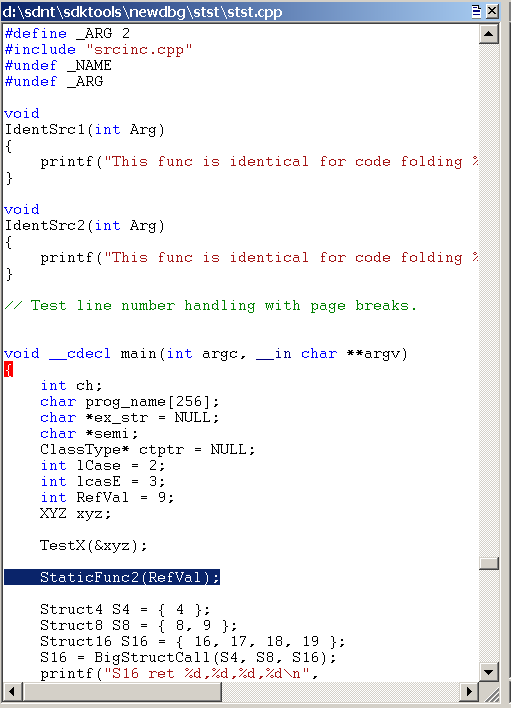
Each source file resides in its own Source window. The title of each Source window is the full path of the source file.
Using the Source Window
Each Source window displays the text of one source file. You cannot edit a source file in the debugger. For more information about changing the font and tab settings, see Changing Text Properties.
To select an entire word or token in a Source window, double-click the word or C++ token.
Shortcut Menu
Each Source window has a shortcut menu with additional commands. To access the menu, right-click the title bar or click the icon that appears near the upper-right corner of the window ( ). The menu contains the following commands:
- Set instruction pointer to current line changes the value of the instruction pointer to the instruction that corresponds to the current line. This command is equivalent to using the Edit | Set Current Instruction command or pressing CTRL+SHIFT+I.
- Edit this file opens the source file in a text editor. The editor is determined by the WinDiff editor registry information or by the value of the WINDBG_INVOKE_EDITOR environment variable. For example, consider if the value of WINDBG_INVOKE_EDITOR is the following.
c:\my\path\myeditor.exe -file %f -line %l
In this case, Myeditor.exe will open to the one-based line number of the current source file. The %l option indicates that line numbers should be read as one-based, while %f indicates that the current source file should be used. Other substitution possibilities include %L, which indicates that line numbers are zero-based, and %p, which can also indicate that the current source file should be used.
- Copy copies the current selection to the clipboard. If there is no current selection, this command has no effect.
- Copy file path to clipboard copies the file path of the Source window to the clipboard.
- Evaluate selection evaluates the currently-selected text by using the C++ expression evaluator. The result appears in the Debugger Command window. If the selected text includes more than one line, a syntax error results. This command is equivalent to using the Edit | Evaluate Selection command, pressing CTRL+SHIFT+V, or using the ?? (Evaluate C++ Expression) command with the selected text as its argument.
- Display selected type displays the data type of the selected object. This display appears in the Debugger Command window. If the selected text includes more than a single object, a syntax error or other irregular results might be displayed. This command is equivalent to using the Edit | Display Selected Type command or pressing CTRL+SHIFT+Y.
- (Menu only) Open memory window for selected value opens a new docked Memory window that displays memory starting at the address of the selected expression.
- (Menu only) Add selection to Watch window appends the selected source token to Watch window.
- Disassemble at current line causes the instruction that corresponds to the current line to appear in the Disassembly window. The selected line is highlighted in the Source window and in the Disassembly window, but this command affects only the display—the instruction pointer is not changed. If the Disassembly window is closed when this command is clicked, it is opened.
- Select source language displays a list of programming languages. Select the programming language that you used to generate the source file, and then click OK to enable basic syntax highlighting for the current Source window. Select <None> to disable syntax highlighting for the current Source window.
- Dock or Undock causes the window to enter or leave the docked state.
- (Menu only) Move to new dock closes the Source window and opens it in a new dock.
- (Menu only) Set as tab-dock target for window type sets the selected Source window as the tab-dock target for other Source windows. All Source windows opened after one is chosen as the tab-dock target are automatically grouped with that window in a tabbed collection. The Source Window marked as the tab-dock target will not close when Window | Close All Source Windows is selected. This allows you to set a placeholder window that will not be closed unless you want it to be.
- Always floating causes the window to remain undocked even if it is dragged to a docking location.
- Move with frame causes the window to move when the WinDbg frame is moved, even if the window is undocked. For more information about docked, tabbed, and floating windows, see Positioning the Windows.
- Help opens this topic in the Debugging Tools for Windows documentation.
- Close closes this window.
Source Window Colors and Hover Evaluation
If the debugger recognizes the source file name extension, the Source window displays certain syntax elements in color. To turn off or change the colors, do the following:
- To turn the syntax colors off in a single window, open the Source window's shortcut menu, click Select source language, and then click <None>.
- To turn the syntax colors off for all Source windows, select Options from the View menu. Then clear the Parse Source Languages check box.
- To change the syntax colors, select Options from the View menu. Then, in the Colors area, select a syntax element and click the Change button to change the color.
- The parsing method that is used for the highlighting is determined by the programming language that is associated with the file extension for the source file. To change the programming language that is associated with a specific file extension, use the File Extensions for Source Languages dialog box. To open this dialog box, in the WinDbg window, on the View menu, click Source language file extensions.
The line that represents the current program counter is highlighted in green. However, if you select a line with the mouse or by using one of the Edit | Go to Xxx commands, the selected line is green and the line that represents the current program counter is not highlighted. Lines at which breakpoints are set are highlighted as well. Enabled breakpoints are highlighted in red and disabled breakpoints are highlighted in yellow. If a breakpoint coincides with the current program counter, it is highlighted in purple.
If you select a Source window and then use the mouse to hover over a symbol in that window, the symbol will be evaluated. The evaluation is the same as that produced by the dt (Display Type) command. To deactivate this evaluation, select Options from the View menu. Then clear the Evaluate on hover check box.
Additional Information
For more information about source debugging and related commands, see Debugging in Source Mode. For more information about docked, tabbed, and floating windows, see Positioning the Windows. For more information about all techniques that you can use to control debugging information windows, see Using Debugging Information Windows.
Build machine: CAPEBUILD