 ) on the toolbar. ALT+SHIFT+1 will close the Debugger Command window.)
| Debugging Tools for Windows |
The Debugger Command window is the primary debugging information window in WinDbg. You can enter debugger commands and view the command output in this window.
Note This window displays "Command" in the title bar. However, this documentation always refers to this window as "the Debugger Command window" to avoid confusing it with the Command Prompt windows that are used to issue Microsoft MS-DOS commands.
When you are debugging in user mode, the Debugger Command window corresponds to the whole CDB window. When you are debugging in kernel mode, the Debugger Command window corresponds to the KD window. However, certain commands work differently in the different debuggers. For more information about the differences, see the topics about each command.
To open or switch to the WinDbg Debugger Command window, in the WinDbg window, on the View menu, click Command. (You can also press ALT+1 or click the Command (Alt+1) button () on the toolbar. ALT+SHIFT+1 will close the Debugger Command window.)
The following figure shows an example of a Debugger Command window.
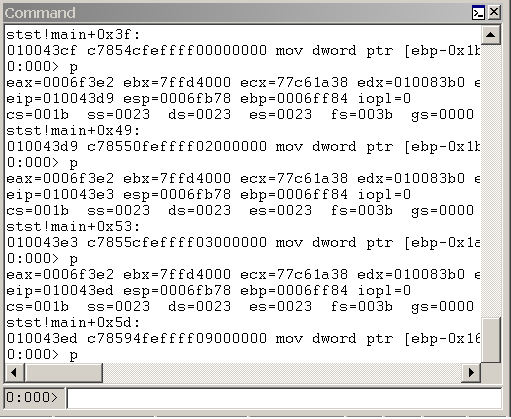
In WinDbg, the Debugger Command window is split into two panes. You type commands in the smaller pane (the command entry pane) at the bottom of the window and view the output in the larger pane at the top of the window.
In the command entry pane, use the UP ARROW and DOWN ARROW keys to scroll through the command history. When a command appears, you can edit it or press ENTER to run the command. The cursor does not have to be at the end of the line for this feature to work correctly.
Note To paste the contents of the clipboard into the command entry pane, right-click anywhere in the command entry pane, and then click Paste.
The Debugger Command window contains a shortcut menu with additional commands. To access this menu, right-click the title bar of the window or click the icon near the upper-right corner of the window (). The menu contains the following commands:
For more information about how to use the Debugger Command window, see The Debugger Command Window. For more information about docked, tabbed, and floating windows, see Positioning the Windows. For more information about all techniques that you can use to control debugging information windows, see Using Debugging Information Windows.