Disassembly Window
The Disassembly window displays executable code in assembly language.
Opening the Disassembly Window
To open or switch to the Disassembly window, in the WinDbg window, on the View menu, click Disassembly. (You can also press ALT+7 or click the Disassembly (Alt+7) button ( ) on the toolbar. ALT+SHIFT+7 will close the Disassembly Window.)
The following figure shows an example of a Disassembly window.
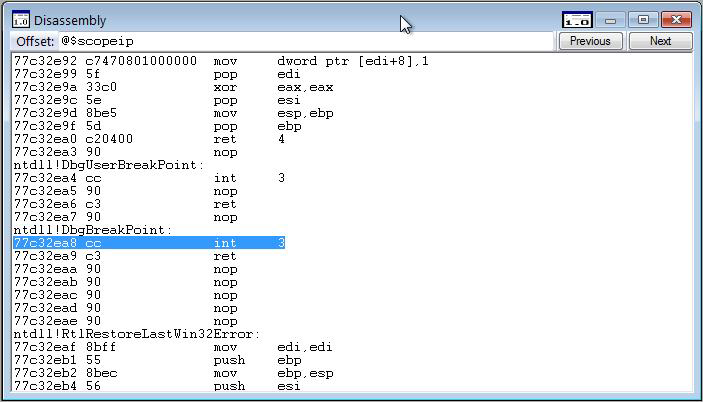
The debugger takes a section of memory, interprets it as binary machine instructions, and then disassembles it to produce an assembly-language version of the machine instructions. The resulting code is displayed in the Disassembly window.
Using the Disassembly Window
In the Disassembly window, you can do the following:
- To disassemble a different section of memory, in the Offset box, type the address of the memory you want to disassemble. (You can press ENTER after typing the address, but you do not have to.) The Disassembly window displays code before you have completed the address; you can disregard this code.
- To see other sections of memory, click the Previous or Next button or press the PAGE UP or PAGE DOWN keys. These commands display disassembled code from the preceding or following sections of memory, respectively. By pressing the RIGHT ARROW, LEFT ARROR, UP ARROW, and DOWN ARROW keys, you can navigate within the window. If you use these keys to move off of the page, a new page will appear.
- If you want to disassemble a section of memory that does not contain machine instructions, the debugger displays error messages.
- The line that represents the current program counter is highlighted in green, unless you select a line with the mouse or by using one of the Edit | Go to Xxx commands. If you select a line with the mouse or a Edit | Go to Xxx command, the selected line is green and the line that represents the current program counter is not highlighted.
- Lines at which breakpoints are set are highlighted. An enabled breakpoint is highlighted in in red, a disabled breakpoint is highlighted in yellow, and a breakpoint that coincides with the current program counter is highlighted in purple.
Toolbar and Shortcut Menu
The Disassembly window has a toolbar that contains two buttons and a shortcut menu with additional commands. To access the menu, right-click the title bar or click the icon that appears near the upper-right corner of the window (). The toolbar and menu contain the following commands:
- (Toolbar only) The Offset box enables you to specify a new address for disassembly.
- (Toolbar and menu) Previous (on the toolbar) and Previous page (on the shortcut menu) causes the debugger to disassemble and display the instructions immediately prior to the current display.
- (Toolbar and menu) Next (on the toolbar) or Next page (on the shortcut menu) causes the debugger to disassemble and display the instructions immediately after the current display.
- (Menu only) Go to current address opens the Source window with the source file that corresponds to the selected line in the Disassembly window and highlights this line.
- (Menu only) Disassemble before current instruction causes the current line to be placed in the middle of the Disassembly window. This command is the default option. If this command is cleared the current line will appear at the top of the Disassembly window, which saves time because reverse-direction disassembly can be time-consuming.
- (Menu only) Highlight instructions from the current source line causes all of the instructions that correspond to the current source line to be highlighted. Often, a single source line will correspond to multiple assembly instructions. If code has been optimized, these assembly instructions might not be consecutive. This command enables you to find all of the instructions that were assembled from the current source line.
- (Menu only) Show source line for each instruction displays the source line number that corresponds to each assembly instruction.
- (Menu only) Show source file for each instruction displays the source file name that corresponds to each assembly instruction.
- (Menu only) Toolbar turns the toolbar on and off.
- (Menu only) Dock or Undock causes the window to enter or leave the docked state.
- (Menu only) Move to new dock closes the Disassembly window and opens it in a new dock.
- (Menu only) Set as tab-dock target for window type is unavailable for the Disassembly window. This option is only available for Source or Memory windows.
- (Menu only) Always floating causes the window to remain undocked even if it is dragged to a docking location.
- (Menu only) Move with frame causes the window to move when the WinDbg frame is moved, even if the window is undocked. For more information about docked, tabbed, and floating windows, see Positioning the Windows.
- (Menu only) Help opens this topic in the Debugging Tools for Windows documentation.
- (Menu only) Close closes this window.
Additional Information
For more information about assembly debugging and related commands and a full explanation of the assembly display, see Debugging in Assembly Mode. For more information about docked, tabbed, and floating windows, see Positioning the Windows. For more information about all techniques that you can use to control debugging information windows, see Using Debugging Information Windows.
Build machine: CAPEBUILD