Calls Window
The Calls window displays the current call stack information.
Opening the Calls Window
To open or switch to the Calls window, in the WinDbg window, on the View menu, click Call Stack. (You can also press ALT+6 or click the Calls (Alt+6) button ( ) on the toolbar. ALT+SHIFT+6 will close the Calls Window.)
The following figure shows an example of a Calls window.
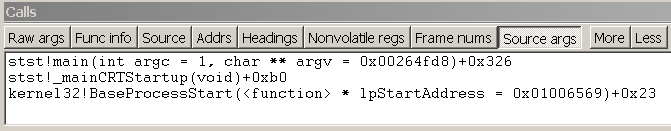
The Calls window displays the call stack information in several columns, most of which can be visible or hidden. If none of the optional columns are visible, only the name or offset of each function is displayed.
Using the Calls Window
To move to the corresponding call location in the Source window or Disassembly window, double-click a line of the call stack, or select a line and press ENTER. This action also changes the local context to the selected stack frame. For more information about running to or from this point, see Controlling the Target.
In user mode, the stack trace is based on the stack of the current thread. For more information about the stack of the current thread, see Controlling Processes and Threads.
In kernel mode, the stack trace is based on the current register context. You can set the register context to match a specific thread, context record, or trap frame. For more information about setting the register context, see Register Context.
Toolbar and Shortcut Menu
The Calls window has a toolbar that contains several buttons and has a shortcut menu with additional commands. To access this menu, right-click the title bar or click the icon near the upper-right corner of the window (). The toolbar and menu contain the following buttons and commands:
- (Toolbar and menu) Raw args displays the first three parameters that are passed to the function. On an x86-based processor, this display includes the first three parameters that are passed to the function ("Args to Child"). On an Itanium-based processor, this display includes the parameters that are passed to the function ("Arguments to Callee"), if the Nonvolatile regs button is also turned on.
- Func info displays Frame Pointer Omission (FPO) data and other internal information about the function. This command is available only on an x86-based processor.
- Source displays source module names and line numbers after the function names (if the debugger has this information).
- Addrs displays various frame-related addresses. On an x86-based processor, this display includes the base pointer for the stack frame ("ChildEBP") and the return address ("RetAddr"). On an Itanium-based processor, this display includes a pointer to the function that is being called ("Callee-BSP") and the return address ("Return-RA"), unless both the Args and Nonvolatile regs buttons are turned on as well.
- Headings displays column headings at the top of each column.
- Nonvolatile regs displays the nonvolatile portion of the register context. This command is available only on an Itanium-based processor.
- Frame nums displays frame numbers. Frames are always numbered consecutively, beginning with zero.
- Arg types displays detailed information about the arguments that are expected and received by the functions in the stack.
- More changes the length of the stack trace. Each time you click More, the stack display increases by ten frames, if a stack trace of this length is available.
- Less changes the length of the stack trace. Each time you click Less, the stack display decreases by ten frames, unless this change would cause the stack display to be shorter than ten frames total.
- (Menu only) Copy stack to clipboard copies the current contents of the Calls window to the clipboard.
- (Menu only) Toolbar turns the toolbar on and off.
- (Menu only) Dock or Undock causes the window to enter or leave the docked state.
- (Menu only) Move to new dock closes the Calls window and opens it in a new dock.
- (Menu only) Set as tab-dock target for window type is unavailable for the Calls window. This option is only available for Source or Memory windows.
- (Menu only) Always floating causes the window to remain undocked even if it is dragged to a docking location.
- (Menu only) Move with frame causes the window to move when the WinDbg frame is moved, even if the window is undocked. For more information about docked, tabbed, and floating windows, see Positioning the Windows.
- (Menu only) Help opens this topic in the Debugging Tools for Windows documentation.
- (Menu only) Close closes this window.
Additional Information
For more information about stack traces and for other ways to display stack traces, see Viewing the Call Stack. For more information about the register context and the local context, see Changing Contexts. For more information about docked, tabbed, and floating windows, see Positioning the Windows. For more information about all techniques that you can use to control debugging information windows, see Using Debugging Information Windows.
Build machine: CAPEBUILD