Command Browser Window
The Command Browser window displays and stores the text results of a debugger command. This window creates a command reference that enables you to view the results of a specific command without re-entering the command. The Command Browser window also provides navigation through the stored commands, so you can more quickly access commands than with the Debugger Command window.
Opening the Command Browser Window
To open or switch to the Command Browser window, in the WinDbg window, on the View menu, click Command Browser. (You can also press CTRL+N or click the Command Browser (Ctrl+N) button ( ) on the toolbar. ALT+SHIFT+N will close the Command Browser Window.)
The following figure shows an example of a Command Browser window.
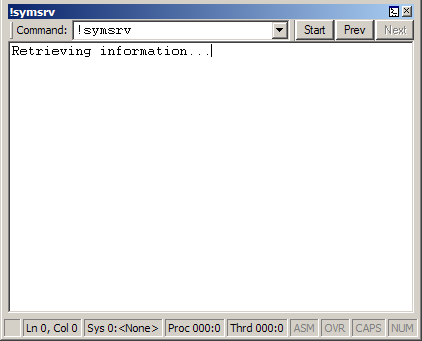
The Command Browser window has a menu in which you can enter or select commands, several navigation buttons, and a pane that shows the results of the current command.
Using the Command Browser Window
In the Command Browser window, you can do the following:
- To enter a command, type it in the Command box.
- To view the results of a previously entered command, use the Start, Prev, and Next buttons to scroll through the command list, or select one of the preceding 20 commands from the Command menu. To find a command that is not one of the preceding 20 commands, use the Next button.
The Command Browser window has a shortcut menu with additional commands. To access the menu, right-click the title bar or click the icon near the upper-right corner of the window (). The context menu contains the following commands:
- Start, Prev, and Next move the cursor to the start of the command history or to the previous or next command, respectively.
- Add to Recent Commands puts the current command into the Recent Commands menu of the View menu in the WinDbg window. Recent commands are saved in the workspace.
- Toolbar turns the toolbar on and off.
- Dock or Undock causes the window to enter or leave the docked state.
- (Menu only) Move to new dock closes the Command Browser window and opens it in a new dock.
- (Menu only) Set as tab-dock target for window type is unavailable for the Command Browser window. This option is only available for Source or Memory windows.
- Always floating causes the window to remain undocked even if it is dragged to a docking location.
- Move with frame causes the window to move when the WinDbg frame is moved, even if the window is undocked. For more information about docked, tabbed, and floating windows, see Positioning the Windows.
- Close closes this window.
Additional Information
For more information about docked, tabbed, and floating windows, see Positioning the Windows. For more information about all techniques that you can use to control debugging information windows, see Using Debugging Information Windows.
Build machine: CAPEBUILD