 ) on the toolbar. ALT+SHIFT+9 will close the Processes and Threads Window.)
| Debugging Tools for Windows |
The Processes and Threads window displays information about the systems, processes, and threads that are being debugged. This window also enables you to select a new system, process, and thread to be active.
To open or switch to the Processes and Threads window, in the WinDbg window, on the View menu, click ) on the toolbar. ALT+SHIFT+9 will close the Processes and Threads Window.)
The following figure shows an example of a Processes and Threads window.
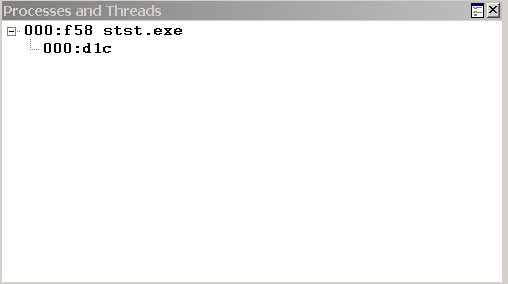
The Processes and Threads window displays a list of all processes that are currently being debugged. The threads in the process appear under each process. If the debugger is attached to multiple systems, the systems are shown at the top level of the tree, with the processes subordinate to them, and the threads subordinate to the processes.
Each system listing includes the server name and the protocol details. The system that the debugger is running on is identified as <Local>.
Each process listing includes the internal decimal process ordinal that the debugger uses, the hexadecimal process ID, and the name of the application that is associated with the process.
Each thread listing includes the internal decimal thread ordinal that the debugger uses and the hexadecimal thread ID.
In the Processes and Threads window, you can do the following:
The Processes and Threads window has a shortcut menu with additional commands. To access the menu, right-click the title bar or click the icon near the upper-right corner of the window (). The menu contains the following commands:
For other methods of displaying or controlling systems, see Debugging Multiple Targets. For other methods of displaying or controlling processes and threads, see Controlling Processes and Threads. For more information about docked, tabbed, and floating windows, see Positioning the Windows. For more information about all techniques that you can use to control debugging information windows, see Using Debugging Information Windows.